The 260th anniversary of the Murray Map: The St. Lawrence Valley through the eyes and pens of British military engineers

By Isabelle Charron

Colour photo of a very large hand-drawn map made up of 44 sheets spread over a dark tiled floor. A smaller, rectangular map is located on a table in the upper-left corner.

Plan of Canada or the province of Quebec from the uppermost settlements to the island of Coudre […], 1761–1763 (item 5446324). The map was assembled with all the necessary precautions on the floor of the Library and Archives Canada (LAC) Preservation Centre, in Gatineau. The assembled map is about 8.8 m by 15.5 m in size. James Cook’s large map of the St. Lawrence (e010691696) is displayed on a table, seen here in the upper-left corner. Photo: David Knox, LAC

In September 1760, the British army took Montréal, but there was still no guarantee that it would hold on to the heart of New France and Canada (the present St. Lawrence Valley). It had little knowledge of the territory it occupied or of the river and land lines of communication with New England. This lack of knowledge weakened its hold on these areas. To make up for this, General James Murray, Governor of Quebec, undertook to have the St. Lawrence Valley mapped in detail. The occupation provided an advantage: many military engineers were already present in the territory, including the talented John Montresor and Samuel Holland. Holland settled in the city of Québec and had a significant impact on the history of cartography in Canada. The maps and information compiled during this major project were ultimately sent to King George III of England and senior officers to improve their knowledge of the territory and its inhabitants. These documents would become essential tools in the event of a handover to France, which could require a new invasion attempt.

Thus, in spring 1761—260 years ago—teams surveyed the entire area from Les Cèdres to Île aux Coudres. During their journey, they included every element of physical and human geography: relief; cultivated, wooded and swampy land; rivers; roads; village cores, including houses, churches, and mills; and many other sightings. They also included the First Nations communities of Kahnawake, Kanesatake, Wendake, Odanak and Wôlinak. Fortifications and British troop positions were also represented. General Murray also demanded that, for each village, the number of families and the number of men able to bear arms be counted and that these data be included on the map. It should be noted that the location of the logbooks belonging to the surveyors who took part in this extensive cartography project remains unknown.

Colour map showing a river and islands, on which the words “St. Rose” are written at centre, towards the bottom of the map.

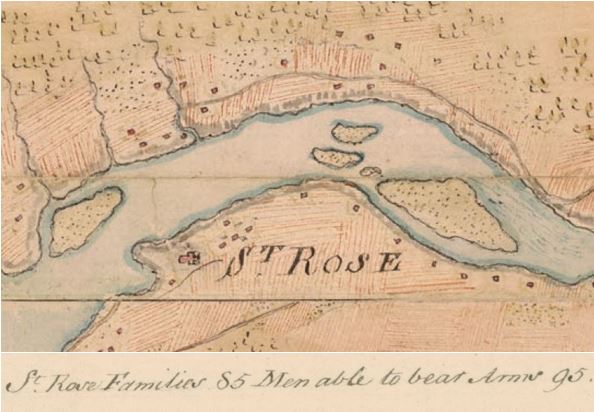
Sainte-Rose (Laval). At the time, surveyors noted that Sainte-Rose, located on the south shore of the Rivière des Mille Îles, illustrated above, had 85 families and 95 men able to bear arms. The communities of Boisbriand and Rosemère are located on the north shore of the river. Details of sheet no. 9. (e010944374_9)

Colour map showing a river and a village with the words “New Lorrette” written at centre, towards the top of the map.

Wendake. Detail of sheet no. 33. (e010944374_33)

Seven immense hand-drawn maps of the St. Lawrence Valley (commonly referred to as the “Murray Maps”) were drawn as part of this project, each including numerous sheets. Three draftsmen, Charles Blaskowitz, Digby Hamilton and Charles McDonnell, drew the final, watercolour-enhanced versions so that they could appeal to their prestigious recipients. Two of these maps are part of LAC’s collection: the map belonging to the Board of Ordnance (item 5506021), which was tasked with supplying the army and military engineers, and the map belonging to James Murray (item 5446324). Two maps are in the British Library in London: the map belonging to William Pitt, Minister of War and future Prime Minister of Great Britain, and the map belonging to King George III. Another map, which may have been intended for Governor of Montréal Thomas Gage, is kept at the William L. Clements Library of the University of Michigan in Ann Arbor. The other two maps, including Commander-in-Chief Jeffery Amherst’s, are missing. Perhaps they will re-emerge one day? Since the Murray Maps reported military intelligence for that time, they were never engraved for publication. The extent of the territory represented, the form followed, and the style of drawing differ somewhat from one map to another. Thus, the Board of Ordnance map, the design of which is more artistic, covers a slightly smaller area, from Les Cèdres to Cap Tourmente. It consists of 23 sheets of varying dimensions divided into four sections. The map intended for James Murray includes 44 sheets of roughly the same size and extends to Île aux Coudres.

Colour map showing a river and a village with the words “Château Richer” written near the centre of the map.

Château-Richer. Detail of sheet no. 36. (e010944374_36)

No similarly detailed map of this immense territory, on this large scale, had been drawn under the French Regime. Even still, cartographic production had been very prolific: think of the maps of Jean-Baptiste-Louis Franquelin, Gédéon de Catalogne and Jean-Baptiste de Couagne, or even the maps created by Jacques-Nicolas Bellin (e.g., item 3693313) at the Dépôt des cartes et plans de la Marine, in Paris, using information from the colony. The Murray Maps are therefore a unique representation of the St. Lawrence Valley on the eve of the official transfer of New France to England through the Treaty of Paris of 1763. They constitute one of the most significant cartographic projects undertaken by the British army during the 18th century, along with projects carried out in Scotland (Roy, 1747–1755), Florida (De Brahm, 1765–1771), Bengal (Rennell, 1765–1777) and Ireland (Vallancey, 1778–1790).

Colour map showing a basin formed where a river widens. An archipelago of about 15 small islands borders the right shore of the basin. The words “Bason of Chambly” are written near the top of the map.

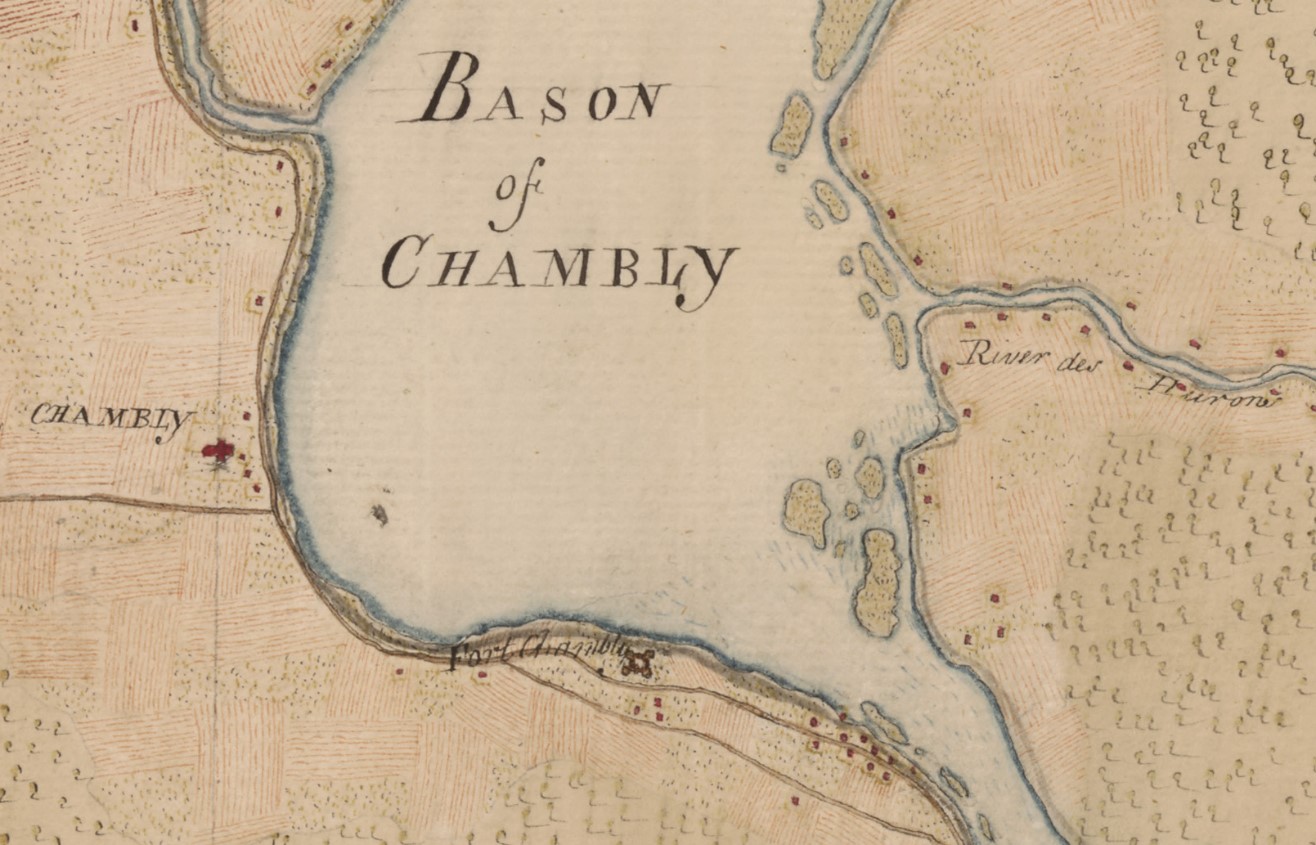
Chambly, Fort Chambly, and Saint-Mathias-sur-Richelieu. Detail of sheet no. 11. (e010944374_11)

This Flickr album contains the 44 sheets of James Murray’s personal copy, which was restored and then re-digitized. The finding aid includes the index map on which the electronic copy numbers for each sheet have been added and a comprehensive list that makes it easier to search for and identify places (note that today’s toponyms are used). You can easily locate the sheets that interest you and download images using LAC’s Collection Search tool.

A large part of the built heritage that appears on the Murray Map has disappeared, the landscape has undergone major transformations, and the representation of many features is not perfect. Nevertheless, you may be able to find the house of your ancestors, your neighbourhood, the church or mill that you visited on vacation, or even the roads that you have travelled over the years. Comparing the Murray Map with current images, like those found in Google Maps, is also very interesting. You can also use Co-Lab, LAC’s crowdsourcing tool, to help further document this cartographic treasure. The possibilities are many. Explore as you wish!

Enjoy your trip to the 18th century…through the eyes and pens of British military engineers.

Colour map showing a river, houses, a church, and a road. The words “Pointe du Lac” are written near the bottom of the map.

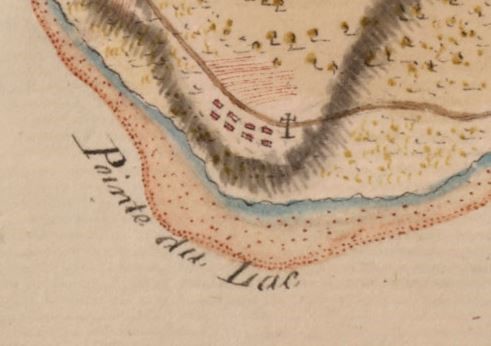
Pointe-du-Lac (Trois-Rivières). Detail of sheet no. 22. (e010944374_22)

To learn more:


This blog was written by Isabelle Charron, early cartography archivist in the Specialized Media Section of the Private Archives Division at Library and Archives Canada.

Guest curator: Annabelle Schattmann

Banner for the guest curator series. CANADA 150 is in red along the left side of the banner and then the bilingual text: Canada: Who Do We Think We Are? and under that text is Guest curator series.Canada: Who Do We Think We Are? is a new exhibition by Library and Archives Canada (LAC) marking the 150th anniversary of Canadian Confederation. This exhibition is accompanied by a year-long blog series.

Join us every month during 2017 as experts, from LAC, across Canada and even farther afield, provide additional insights on items from the exhibition. Each “guest curator” discusses one item, then adds another to the exhibition—virtually.

Be sure to visit Canada: Who Do We Think We Are? at 395 Wellington Street in Ottawa between June 5, 2017, and March 1, 2018. Admission is free.


The Chewett Globe by W.C. Chewett & Co., ca. 1869

A large globe in a wood and brass stand.

Terrestrial globe by W.C. Chewett & Co. for the Ontario Department of Education, ca. 1869. (AMICUS 41333460)

This globe was one of the first produced in Canada, around the time of Confederation. Designed for use in schools, it was part of a nationalistic push to define and explain the brand new country.


Tell us about yourself

I have travelled extensively for both pleasure and work. I have been to Europe multiple times, and Peru for archaeological digs as a student. I also spent over a year living in Japan as a high school student, and it was an unforgettable experience. The most important lesson I learned was to appreciate and respect things that are different, strange, and sometimes incomprehensible. It taught me to be critical of my biases and the culture I live in, reflexes which promote cohesive living in a multicultural world.

Is there anything else about this item that you feel Canadians should know?

Because of my expertise and love of travel, I have chosen to discuss the Chewett Globe. Maps are a lot of fun! Whenever I travel, I like to look up the country’s world map because they always put their country in the middle of the map. This inevitably causes distortion in the distances between countries and the size of oceans as our planet is spherical. Seeing Canada shrink and stretch has always made me smile and helped me understand how other people see and understand their world, if only a little bit.

Our world is also ever changing, from its physical features, such as rivers and mountains, or abstract constructs, such as names and borders. Therefore, maps must be continuously updated, which allows us to trace history through changes in maps. Maps are critical to my work as an archaeologist. Old city plans might reveal where old buildings once stood or abandoned cemeteries were located but have since been built over and faded from our collective memory. I also must consider how the landscape may have looked like in the past to understand what resources people could access, and what might have inspired them to choose a specific location to camp or imbue meaning onto the landscape through stories and legends.

I think Mr. William Cameron Chewett, the person whose company created this globe, would have appreciated these thoughts. Although his profession was printing, his family were involved with mapping Upper Canada. His grandfather, William Chewett, worked as surveyor-general and surveyed most of what is now Ontario, while his father, James Chewett also worked as a surveyor before building many known Toronto buildings. W.C. Chewett and Co. was considered one of Canada’s foremost printing and publishing firms. The firm produced award-winning lithographs between 1862 and 1867, with yearly first place awards, and had a large publication output ranging from periodicals, directories, and the Canadian Almanac, to law and medicine books. In addition, the retail store was a popular social gathering spot. The globe was created in the company’s last year (1869) prior to it being bought and renamed the Copp, Clark and Company.

A map of Canada West, what is now southern Ontario, with coloured outlines to indicate counties. The legend contains a list of railway stations with their respective distances [to Toronto?].

Map of Canada West, engraved and published in the Canadian Almanack for 1865 by W.C. Chewett & Co., Toronto. (MIKAN 3724052)

For Canada’s150th anniversary, I think it is worth reflecting on the changes that have come to pass in the last 150 years, which the Chewett Globe can literally show us. In my lifetime, I observed the creation of the territory of Nunavut and the renaming of various streets in my neighbourhood. What changes have you seen in your life and how did they affect you and your community?

Tell us about another related item that you would like to add to the exhibition

When most people think of maps, they think of geography and political borders, but maps can also be used to illustrate and describe almost anything, including census information, spoken languages, and group affiliations amongst others. To continue the topic, I have selected an 1857 map of North America that shows the regions where various First Nations groups resided at the time. Ideally, if I were to add this map to the exhibition, I would also want to include a modern map of where First Nation groups reside to show the public the momentous changes lived by our fellow citizens to allow them to see these changes as clearly as those they can pick out by comparing the globe to any modern map of Canada.

My other reasoning is a little more selfish. As an anthropologist, I understand and have learned through experience that the best way to appreciate and respect another culture is to learn about it, about the people, and where possible, live in it. Growing up, I had very little exposure to First Nations, their culture and history. Because of this, I never developed much of an appreciation for their culture or interest in learning about them. As an anthropologist and Canadian, I was ashamed of these feelings and sad when fellow Canadians express similar views. For the last few years, I have actively sought to educate myself. By including this piece, I hope to inspire others to appreciate, respect, and learn more about their fellow Canadians. The topic is particularly meaningful on Canada’s milestone year as this is the year we should celebrate coming together and developing stronger bonds, one nation to another.

A large colour map of North America denoting territories of various Aboriginal bands with legends in the corners.

Map of North America denoting the boundaries and location of various Aboriginal groups. (MIKAN 183842)

Biography

Colour headshot of a woman with glasses and long hair.Annabelle Schattmann is a physical anthropologist. She holds a Master of Arts in Anthropology from McMaster University (2015) and a Bachelor of Arts in Anthropology from Trent University (2012). She has participated in multiple research projects including a dig in Peru, cemetery excavation in Poland, and research on vitamin C and D deficiencies from various time periods in Canada and Europe.

Related Resources

McLeod, Donald W. “Chewett, William Cameron.” Dictionary of Canadian Biography.

Samuel de Champlain’s General Maps of New France

In the fall of 1612, Samuel de Champlain had an engraving of his first detailed map of New France made in Paris. The map contained new geographic information, based on his own explorations from 1603 onward. The site of Montreal is clearly identified. Using information obtained from Aboriginal peoples, he was able to include previously uncharted areas, such as Lake Ontario and Niagara Falls. He also made use of other maps to depict certain regions, including Newfoundland. Although the engraving was made in 1612, the map was not published until the following year as an appendix to Voyages, Champlain’s 1613 account of his journeys.

Carte geographique de la Nouvelle Franse faictte par le sieur de Champlain Saint Tongois cappitaine ordinaire pour le roy en la marine. Faict len 1612.

Carte geographique de la Nouvelle Franse faictte par le sieur de Champlain Saint Tongois cappitaine ordinaire pour le roy en la marine. Faict len 1612.(e010764733)

While back in France in the summer of 1613, Champlain had an engraving made of a second version of a general map that he had begun the previous year, which he also published in his 1613 book. In that map, he incorporated his most recent geographic findings, including the Ottawa River, which he was the first to depict. His depiction of Hudson Bay was deliberately inspired by a map of Henry Hudson’s voyages.  

Carte geographique de la Nouvelle Franse en son vray meridiein. Faictte par le Sr Champlain, Cappine. por le Roy en la marine – 1613.

Carte geographique de la Nouvelle Franse en son vray meridiein. Faictte par le Sr Champlain, Cappine. por le Roy en la marine – 1613. (e010764734)

An incomplete general map by Champlain also exists. The engraving was made in 1616, although the map was never published. The only known copy is held by the John Carter Brown Library.

In 1632, Champlain published his last major map of New France, which was included in his final book, Les Voyages de la Nouvelle France occidentale, dicte Canada. He had been living in France for nearly three years, having been driven out of Quebec by the Kirke brothers in 1629. This updated map contains little new information verified by Champlain himself, as his own explorations came to an end in 1616. He based the revised version on the invaluable information conveyed to him by others, chief among them Étienne Brûlé. Nevertheless, this map represents an important milestone in the history of North American cartography and was widely used by other mapmakers. There are two versions of this map. Among the differences between them are the representation of Bras d’Or Lake or a chain of mountains on Cape Breton Island. Both versions of the map are held by Library and Archives Canada. The first can be seen here:

Carte de la Nouvelle France, augmentée depuis la derniere, servant a la navigation faicte en son vray meridien, 1632.

Carte de la Nouvelle France, augmentée depuis la derniere, servant a la navigation faicte en son vray meridien, 1632. (e010771375)

Suggested reading to learn more about this subject: Conrad E. Heidenreich and Edward H. Dahl, “Samuel de Champlain’s Cartography, 1603-32”, in Raymonde Litalien and Denis Vaugeois, eds., Champlain: The Birth of French America. Sillery: Les éditions du Septentrion; and Montreal and Kingston: McGill-Queen’s University Press, 2004, pp. 312-332.