Freedom to Read

By Mary-Francis Turk

At Library and Archives Canada (LAC), we never judge a book by its cover (or its content, for that matter)! We want to make sure that readers and researchers have access to all Canadian publications. LAC’s mandate, as outlined in the Preamble to the Library and Archives of Canada Act, puts emphasis on preserving the documentary heritage of Canada while making it available to the public.

Libraries across Canada have a responsibility to create policies that protect the freedom to read and intellectual freedom. As a national library, LAC has created a permanent collection by acquiring published books, rare and early editions of books and related print material of all kinds.

Through its legal deposit program, LAC acts as a quiet champion against censorship. Every Canadian publication has its place in the national collection. The program has been crucial in aiding LAC’s ongoing efforts to build an inclusive, expansive and accessible national collection.

LAC works closely with publishers to build its collection through the legal deposit program, which is responsible for collecting “materials created in Canada and intended for sale or public distribution.” In doing this, we are able to make material available and preserve it for future generations.

Materials accepted through legal deposit

Canadian publishers and producers submit materials such as

  • Books (monographs)
  • Serials (such as magazines, journals, newsletters)
  • Physical music and video recordings
  • Audiobooks
  • Sheet music
  • Maps
Poster for Freedom to Read Week dated October 19–26, 1986, with three books closed by clamps.

An advertisement promoting reading put out by the Book and Periodical Development Council for Freedom to Read Week in 1986. Library and Archives Canada/Robert Stacey fonds/e010758305. Credit: Michael Hale / Susan Reynolds.

Although it can sometimes feel like censorship is something from the past, there are many examples of more recent instances of challenged publications. This includes several publications that can be found in LAC’s collection:

  • In 2018, David Alexander Robertson’s book Betty: The Helen Betty Osborne Story was “not recommended” for use in Alberta classrooms.
  • In 2016, Robin Stevenson’s book Pride: Celebrating Diversity and Community met resistance during Stevenson’s school visits in British Columbia, Ontario and Quebec.
  • In 2011, Timothy Findley’s book The Wars was used by an Ontario school board in Grade 12 English classes and was subsequently challenged by parents. The school board ultimately decided to keep the book as part of the secondary curriculum.

Canada’s Book and Periodical Council’s Challenged Works List reminds us that publications have historically been and continue to be challenged and censored in Canada. Freedom to Read Week further reminds Canadians that access to publications should not be taken for granted.

Making Canadian publications available to the public and ensuring they are available for future generations is imperative to ongoing intellectual freedom in Canada. This is exactly what we strive to do here in LAC’s legal deposit team.

As we reflect on the freedom to read and the right to intellectual freedom, the task of acquiring and making Canadian publications available to readers across the country seems more important than ever.

Interested in learning more about free expression and censorship in Canada? See a list of the Book and Periodical Council’s English or French works on free expression and censorship in Canada.

Additional resources


Mary-Francis Turk is a Legal Deposit Supervisor in the Private Archives and Published Heritage Branch at Library and Archives Canada.

Vimy Ridge: a journey of maps (part 2)

By Ethan M. Coudenys

Picture the scene of the moments leading up to a massive military advance. On the morning of April 9, 1917, a cold rain falls on the Douai plain in France. To the west, a great number of Canadians have gathered to begin their attack on Vimy Ridge at precisely 5:30 a.m. Of the approximately 30,000 men preparing to advance that day, roughly a third are hidden underground in tunnels built specifically to hide them from the German forces’ lookouts. At the moment of attack, the men burst from the tunnels and shower brimstone and hellfire on the forces that oppose their advance.

A tunnel at Vimy Ridge.

Grange Subway under Vimy Ridge, August 17, 2022. Image courtesy of the author, Ethan M. Coudenys.

These tunnels were mainly constructed by the Welsh Companies of the Royal Engineers. The Welsh miners were mostly professional miners, and they would cut through the chalk stone 10 to 15 metres below the battlefield in near-total darkness. Some 10 kilometres of underground tunnels ran from the furthest Canadian rear trench to the front of the line. They were used to move supplies, run messages and conceal the advancing army on the day of the attack.

Speaking from my experience as a tour guide at the Canadian National Vimy Memorial at Vimy Ridge, these tunnels, often filled with water, bats, rats and unusual smells (probably far worse back then), were incredibly confusing to traverse during the First World War. There were electric lights every 20 metres or so, but the tunnels were dark, twisting and loud. Chalk conducts sound, so soldiers could hear, not only every shell falling on the surface with some clarity, but also miners digging away and the few soldiers and officers shuffling through the tunnels.

To avoid confusion, maps were created to prevent messengers and officers from getting lost in the subterranean labyrinth. Only one of these tunnels, the Grange Subway, is currently open to visitors at the Vimy Ridge National Historic Site. The Durand Group, a research and exploration association, is carrying out the dangerous work of investigating and uncovering tunnels and redoubts, but these efforts have not yet resulted in additional tunnels being opened to the general public. Nevertheless, the Durand Group’s work provides insights into what the maps of different tunnels were like at this time in the war, as the association maps and reports on newly uncovered tunnel systems in France and Belgium.

The attack on Vimy Ridge consisted of two different phases. The first, and most famous, is the taking of the ridge along the 12-kilometre-long front line for which the Canadian Expeditionary Force (CEF) was responsible. The CEF had four main objectives, but Hill 145, the highest part of the ridge, was the declared central target for the operation. The second phase was taking the Pimple (also known as Hill 119). This was a heavily fortified and well-manned artillery and heavy machine gun post at the top of a hill. It was very easy to defend, and very useful if the German forces wanted to regain territory lost in the first phase. Thus, the second phase of the Battle of Vimy Ridge is now known as the Battle of Hill 119 (or the Pimple).

Map showing artillery plan, including smoke screens.

Artillery barrage plan – Battle of Hill 119 (or the Pimple) (MIKAN 3946966). Photo: Ethan M. Coudenys.

Mapping the artillery attack

The Vimy Ridge and Pimple attacks were Canada’s contribution to the larger military operation of the Battle of Arras, which took place along a 30-kilometre front led by mostly British forces. One of the most important elements of the attacks was the efforts of the artillery brigades, for which both Canadian and British artillery units worked in tandem to aid the advance of the infantry troops. This effort required immense preparedness and incredible tenacity. It was critical for artillery units to follow the same schedule, to ensure that the barrage of artillery shells would advance at a very specific pace of 100 metres every three minutes. Every unit was therefore issued maps and specific timings on each of the changes in range, as well as the speed of firing. This tactic was called a rolling (or creeping) barrage.

To expand on the discussion in part 1 of this post, a rolling barrage is a military tactic largely developed by British and Canadian generals who had witnessed the failure of artillery support at the Battle of the Somme in France (July–mid-November 1916). The rolling barrage tactic involved firing a wall of shells into no man’s land and advancing the wall slowly, so that the opposing forces could not exit their shelters to mount an effective defence before the infantry troops reached their line. This tactic was effective in eliminating defensive enemy snipers and machine guns during the start of the Vimy Ridge battle. Canadian writer Pierre Berton states in his work on Vimy Ridge that the roar of the artillery firing was so loud that it could be heard as far away as London. To the soldiers advancing into dangerous territory, it seemed as though the sky was made of lead, because of the sheer number of shells flying overhead.

Let us now turn to the various maps of the artillery on Vimy Ridge. For the assault on Hill 145, it was important for the infantry and artillery to be synchronized. The artillery commanders received the same maps as the infantry units so they could measure the advances of the various divisions and brigades, sometimes kilometres away.

More importantly, the artillery officers received maps of specially chosen target areas, to help them destroy major defensive installations before the infantry came into range of those positions. These target areas could be machine-gun nests, sniper posts, defensive artillery pieces or mortar emplacements. Part of the plan of attack was to ensure that there was a significant time gap between the first and second advance. For example, the distance between a red line and a black line would be roughly a 30-minute interval, during which the secondary wave of infantry and supporting troops could move up. In other words, the artillery would fire on specific targets for a set amount of time, wait 30 minutes to allow the infantry to advance, then fire on more distant targets. This allowed for the infantry to rest and fortify their newly taken positions, while the artillery targeted the potentially dangerous defensive fortifications further along the front.

To capture the Pimple, the strategy was quite different. While the artillery continued to use the rolling barrage, they also used two new tactics that were introduced and developed during the Great War. The first was creating what some scholars have called a “killing field,” where, through heavy artillery fire, defending troops are forced to leave their shelter for open space and then are targeted by machine guns and artillery. The second was the launching of smoke screens. The artillery would launch barrels of burning oil into the battlefield, creating a thick, black cloud of smoke to hide the advancing infantry. These two tactics would become a trademark approach of the Canadians in later battles, including the Battle of Hill 70 in Lens, France (August 15–25, 1917) and the Third Battle of Ypres (Passchendaele) in Belgium (July 31–November 10, 1917).

While the rolling barrage was successful in the preliminary attacks on Hill 145, the capture of the Pimple was one of the most costly battles in Canadian military history, with over 10,000 men killed, injured or missing.

Conclusion

The mapping of a battlefield is not a new concept. From the age of the Roman Empire to the Napoleonic Wars, generals and warlords have used maps to plan attacks and navigate battlefields. However, the development and production of these maps was usually done exclusively for high-ranking officers and non-commissioned members. At the Battle of Vimy Ridge, to ensure better overall preparedness among troops and to prevent confusion among infantry soldiers, maps of the battlefield were produced and distributed widely, so that even low-ranking lieutenants and lance-corporals would have access to the plan of attack. This innovation in how the allies fought during the First World War resulted in a hugely successful attack upon the German forces’ position on Hill 145 (Vimy Ridge) and Hill 119 (the Pimple) during the Battle of Vimy Ridge, part of the greater Battle of Arras. Maps illustrated clear and focused goals for individual units, and they demonstrated the tactics that the soldiers, artillery and support services would use to take the ridge. These maps followed many months of preparations for the Vimy Ridge battle; they were a major contributing factor in the CEF’s successful capture of Hill 145.

Additional resources


Ethan M. Coudenys is a Genealogy Consultant at Library and Archives Canada.

Vimy Ridge: a journey of maps (part 1)

By Ethan M. Coudenys

Cartography is the practice of drawing or making maps; during the First World War, this was vital for planning and preparing attacks and defensive actions. Battles in France like those of the Marne, Somme and Verdun were mostly planned with large maps by high-ranking officers and non-commissioned members. However, for the battle at Hill 145—better known as Vimy Ridge—cartography played an integral role in the planning of the assault by the Canadian Expeditionary Force (CEF).

Group of men going through barbed wire with shells exploding in the background.

Canadians advancing through German wire entanglements, Vimy Ridge, April 1917 (a001087).

Before we begin, we should set the scene by talking about the CEF before the Battle of Vimy Ridge. The Canadians had fought in various battlefields in France and Belgium, including with distinction at Flers-Courcelette (August–November 1916) in France, about 50 kilometres from Vimy. Under the command of Lieutenant-General (later Field Marshal and Governor General) Sir Julian Byng, the CEF had become a very successful fighting force. In November 1916, the Canadians began moving to the east of the French town of Arras. There, they began preparing for an attack on Hill 145, where the German forces had taken nearly three years to build very heavily fortified lines of trenches.

The Battle of Vimy Ridge, which began on April 9, 1917, was not an isolated operation; it was a small part of the Battle of Arras. The two major points of the battle for the ridge, for which the Canadians were responsible, were the ridge itself (Hill 145) and the Pimple (Hill 119). Incredible preparations went into planning this attack.

Between the beginning of the war in 1914 and when the Canadians took up positions in late November 1916, French and Moroccan divisions had tried to take Vimy Ridge. They advanced the allied front line closer to the ridge. During the Battle of Verdun, the British took over these positions, and they expanded and strengthened the relatively weak fortifications. By November 1916, the CEF entered the front line at Vimy with very good fortifications.

Map showing a tunnel-and-crater system.

Map 1 – Map of La Folie battlefield: group of tunnels, near Vimy. Courtesy of Veterans Affairs Canada – European Operations.

The Canadians were called to the line at Vimy for the first time as an entire corps, fighting side by side. This was incredibly important not only for the soldiers but also for the young nation. For many, it signified the start of a process whereby Canadians would collectively build their cultural and national identity.

We can better understand the importance of cartography in battle by first reviewing some of the maps that are presented today at the Visitor Education Centre in the Canadian National Vimy Memorial in France. There, Canadian guides—all university and college students—educate the public about the Battle of Vimy Ridge, including the tunnels that were built to support the advance of Canadian troops in April 1917. In maps 1 and 2, the different tunnels and trench lines used during the battle for the ridge are shown.

Map showing the battlefield during the Battle of Vimy Ridge.

Map 2 – Battlefield map of the Battle of Vimy Ridge: modern map. Courtesy of Veterans Affairs Canada – European Operations.

How were the maps made?

Maps were important for infantry soldiers because they helped to ground and situate them in an environment marked by constant fear, confusion and proximity of death. During the months leading up to the Vimy Ridge battle, soldiers were sent into the German forces’ trenches to gain information about the enemy’s fortifications and weapon emplacements that lined the front. Moreover, the Royal Flying Corps (later the Royal Air Force) used aerial photography to pinpoint areas of fortifications and map points of interest for the attack. Let us examine this gathering of information by soldiers.

The CEF collected information by sending small incursions into the German lines, with soldiers memorizing the layouts of the other side’s trench systems. These could be completed by a small group of men or a very large group (5,000 or more in one instance) and took place from November 1916 until the eve of the battle in April 1917.

During the infamous trench raids, Canadian soldiers would be tasked with memorizing the layout of the trenches and important locations in the German forces’ lines. These vital recollections were later reflected in detailed maps, which were used by the Canadians to help reduce confusion among the infantry. The trench raids could be incredibly dangerous, both for the men raiding and for the defenders. Often these attacks would take place at night, and both attackers and defenders could suffer heavy losses.

Hand-drawn map of German trenches after a raid before the Battle of Vimy Ridge.

Hand-drawn map of German forces’ trenches after a raid, Vimy Ridge, 1917 (MIKAN 4289412). Photo: Ethan M. Coudenys.

The maps that were created as a result of these raids, such as the example above, were often drawn by hand, from memory, by individual soldiers.

What maps were made?

Map showing artillery barrage in the Vimy region in France.

Artillery barrage map, 1st Field Survey Company, Royal Engineers, near Vimy, 1917 (e000000540).

We are very fortunate to have access to a vast number of maps from the Great War in the collection at Library and Archives Canada. Some of the most frequently requested by researchers are the trench line maps of the Western Front. As mentioned above, these maps were drawn through painstaking and sometimes bloody collection of information by soldiers, engineers and pilots. These maps were issued widely to both low-ranking officers and non-commissioned members of the infantry to help them succeed in the attack on April 9, 1917.

The first map issued, and perhaps the most important for the advance, was the barrage map. During the attack on Vimy Ridge, the Canadian artillery, supported by numerous British field artillery units, used the tactic of a rolling (or creeping) barrage to subdue resistance by the German forces while the infantry advanced behind a wall of falling shells. This process was incredibly well timed, and it needed to be, to avoid any friendly fire casualties. Thus, maps were created and used by the artillery units to launch this barrage on the German forces’ lines. These maps detail the targets of the artillery leading up to the four main objectives of the CEF between April 9 and 12, 1917. They show the 100-metre advances of the rolling barrage every three minutes, allowing the infantry units following the barrage to successfully move behind the wall of fire. The maps also show the various targets of particular interest, including fortifications, machine gun emplacements, mortar emplacements and munitions storage areas.

Cardboard map detailing the Western Front at Vimy Ridge.

Infantry soldier’s pocket map, made of cardboard, Vimy Ridge, 1917 (MIKAN 4289412). Photo: Ethan M. Coudenys.

The most widely used maps in the attack on Vimy Ridge were those issued to infantry units. These maps were small copies of larger planning maps used by high-ranking officers, but they included the individual objectives of each platoon and company. This was an incredibly important step in planning and executing the attack on the ridge. Despite the confusion caused by gun and rifle fire, the maps helped the advancing soldiers to stay on course.

The change of policy allowing soldiers to carry their own battlefield maps might seem like a minor one, but it had a significant effect on the CEF’s success in the Battle of Vimy Ridge.

 Additional resources

  • The Underground War: Vimy Ridge to Arras by Phillip Robinson and Nigel Cave (OCLC 752679022)
  • Vimy by Pierre Berton (OCLC 15063735)
  • Vimy 1917: Canadians and the Underground War by Dominique Faivre (OCLC 1055811207)

Ethan M. Coudenys is a Genealogy Consultant at Library and Archives Canada.

Why are the 1931 census returns organized geographically?

At Library and Archives Canada (LAC), we receive questions about why materials in our collections are organized the way they are.

When it comes to the census returns, typically we explain that, as an archive, we acquire the census returns as they are—even when the writing is blurry or unreadable—as historical records. We also strive to maintain the records’ original order and context.

For the 1931 census returns, maintaining the records’ original order is not difficult. Rather than receiving 234,678 pieces of paper, we received 187 microfilm reels. On the microfilm, the imaged census returns are organized, overall, by province (east-to-west) and then by northern area (west-to-east). This is because the Dominion Bureau of Statistics imaged the census returns in order of census district number, and, within each census district, in order of census sub-district number. When we digitized the archival records here at LAC, we worked to ensure that the digital access copies would reflect the archival records’ original order and context to the extent possible. For instance, we grouped digitized images according to the title cards used in the microfilmed images. To each group of digitized images, we added additional metadata, extracted from the Dominion Bureau of Statistics’ listings accompanying the census returns.

A handwritten index card.

Example of a title card used to organize 1931 census returns on microfilm. This title card is for the eight pages of returns from Prince Edward Island, census district 3 (Queens), sub-district 10 (MIKAN 5744023)

But this explanation does not answer the original question: why are the returns from the 1931 census of population organized geographically—by census district and sub-district—in the first place?

For answers to this original question, we turn to the Administrative Report included in the Dominion Bureau of Statistics’ 1936 publication Seventh Census of Canada, 1931, Volume 1, Summary.

Answer 1: Because of the original purpose of the census of Canada. The census returns are organized geographically because of the decennial census’ role in shaping representation in the House of Commons.

“In Canada the immediate, legal raison d’être of the census is to determine representation in the […] House of Commons. Under the [Constitution], the province of Quebec is given a fixed number of seats[…] while the number assigned to the other provinces is pro rata on a population basis as determined by the census[….] The Canadian Census is thus taken primarily to enable a redistribution bill to be passed through Parliament” [Page 32; emphasis added]

It is worth getting a bit technical here. In the early part of the 20th century, redistribution bills updated the number and boundaries of federal electoral districts based on changes in population—as established by the previous decennial census—among other considerations established by law.

A map depicting federal electoral districts in the prairie provinces—the boundaries are indicated by thick blue lines, and the names are indicated in blue type. The map was prepared on a base map featuring rivers and lakes, railways, cities and grid lines.

“Map of Federal electoral districts of Manitoba, Saskatchewan & Alberta” from an atlas created in 1924, prepared by the Department of the Interior (e011315903)

The updated boundaries of federal electoral districts informed the census districts used for enumeration purpose in the subsequent decennial census. In other words, the relationship between federal electoral district and census district had elements of a chicken-and-egg scenario.

Egg: Federal electoral district boundaries, as established in the Representation Act of 1924.

The Representation Act of 1924, sometimes referred to as the Redistribution Act, established the electoral districts to be used in subsequent federal elections. This redistribution of electoral districts was based, in part, on the population count and distribution established by the previous decennial census, namely, the Sixth Census of Canada in 1921.

The Representation Act established the official boundaries of federal electoral districts in form, not in maps.

  • To view transcriptions of these descriptions of electoral districts, consult the Library of Parliament’s online resource “Elections and Candidates” for the 17th parliament; the description of each electoral district can be viewed by clicking on a constituency title listed for the general election of July 28, 1930, and then scrolling below the header “Information” to the description under the subheader “S.C. 1924, c.63,” which refers to the Representation Act.
  • Although the Representation Act did not include maps, the Department of the Interior prepared an atlas with maps depicting the updated federal electoral district boundaries. To view digitized images of the maps in the 12-volume atlas, there are two options. The catalogue record for the Federal electoral district maps, 1924 displays thumbnail images. A 1931 Census Maps research tool supplies links to individual, higher-resolution maps.

Chicken: Census districts used for 1931 census.

1931 census districts used in enumeration mostly corresponded to the federal electoral districts established in the Representation Act of 1924, because

“[f]or the purposes of the census, the Statistics Act requires that the country be first divided into “census districts” corresponding as nearly as possible with the federal electoral divisions or constituencies for the time being—this in view of the association of the census with parliamentary representation.” [Page 51]

Nevertheless, at least eight electoral districts were “too large or too varied in physical or economic character” for the purposes of census work, and so each was split into two or three census districts (in Quebec, Charlevoix–Saguenay, Gaspé, Labelle and Pontiac; in Ontario, Port Arthur–Thunder Bay; in Alberta, Peace River; and in British Columbia, Cariboo and Comox–Alberni). Other areas to be enumerated fell outside a federal electoral district (e.g., Northwest Territories, Royal Canadian Navy ships).

The population established by the Seventh Census of Canada in 1931 was then used to inform the next redistribution of federal electoral districts.

Egg: Federal electoral districts, as established in The Representation Act, 1933

This chicken-and-egg scenario is why, at LAC, we often use federal electoral district maps as working stand-ins for census district maps to help us navigate the census returns from the early part of the 20th century. To navigate the 1931 census returns, we use maps depicting the federal electoral districts as established in the Representation Act of 1924. In the year 2028, we will likely be using the maps depicting federal electoral districts according to The Representation Act of 1933 to help us navigate the 1936 census returns from the prairie provinces after those census returns are transferred to LAC.

Answer 2: Logistics was another reason why the census returns were organized geographically.

The 1931 Census of Canada, like most population censuses, was meant to enumerate each person within the boundaries of the Dominion of Canada once, and only once. For this purpose, land within the borders of Canada, and navy ships, were divided into 15,167 units of enumeration. Each geographical unit of enumeration—called a census sub-district—was assigned to a single enumerator (more or less), tasked with recording each person residing within the census sub-district.

Four people interacting in a sub-zero-degree landscape.

Enumeration proceeding in 1961: An R.C.M.P. member talks to three people from an Inuit community to collect census information (e011177562)

“The census enumerator is the only census official coming into direct contact with the general public; [s/he] is who makes the house-to-house and farm-to-farm canvass and who is primarily responsible for the details collected on the census schedules. The necessity of providing that no more or no less than a suitable amount of work should be assigned to each enumerator (experience has demonstrated this to be a population of 600–800 in ordinary rural districts, and of 1,200–1,800 in urban) […] renders departure necessary in many cases from the electoral boundaries; […] and the polling subdivisions are not always convenient as census sub-districts. In all such cases, however, the division is effected in a way that permits compilation of the results in the form required for the purposes had in mind by the Act.” [Page 51]

Establishing the geographical boundaries to be used in the census was no minor feat:

“The drawing up of the scheme of census districts and sub-districts is a task of considerable magnitude; it is put in hand about two years in advance of the census date, and is carried out not only in the light of conditions revealed in the preceding census, but in consultation with local officials, so that no inhabited area may be overlooked or left unprovided with the organization best suited.” [Page 51]

Ninety-two years later, the task of finding a particular census return among the 1931 census returns that are organized geographically—organized according to census district and sub-district—may seem a little overwhelming. The blog posts Puzzling through 1931 Census sub-districts – Part 1 and Part 2 describes the approaches we use at LAC to navigate the 15,167 sub-districts used for enumeration in the 1931 census.

Puzzling through 1931 Census sub-districts – Part 2

This article contains historical language and content that some may consider offensive, such as language used to refer to racial, ethnic and cultural groups. Please see our historical language advisory for more information.

This is Part 2 of the blog series Puzzling through 1931 Census sub-districts. If not done already, you may want to read Part 1, as it provides tools to help identify the census district that would have included your place of interest in 1931.

As a reminder from Part 1, to find the census returns for a place of interest, we generally need to narrow down, in order, the:

  1. province or territory;
  2. census district or federal electoral district; and
  3. census sub-district

that would have included the place of interest in 1931.

In this blog post, we go over the last step.

STEP 3. Determining the census sub-district

Each 1931 Census district was divided into multiple sub-districts – anywhere from three to 148 – for the purpose of enumeration. The majority of census districts were divided into at least 50 sub-districts.

The hitch is that no maps of 1931 Census sub-district boundaries are known to still exist. Figuring out in which census sub-district one’s place of interest was enumerated requires using one of the following tools:

  1. Street indexes (for 11 major cities)
  2. Finding aid for “Indian Reserves” (First Nations)
  3. Written descriptions of sub-district boundaries.

If your place of interest was in neither a major city nor a First Nations Reserve in 1931, skip directly to the last tool, the written descriptions of sub-district boundaries.

Tool 1: Street indexes

Indexes are available for Halifax (N.S.), Saint John (N.B.), Quebec (Que.), Montréal (Que.), Toronto (Ont.), Hamilton (Ont.), London (Ont.), Winnipeg (Man.), Edmonton (Alta.), Calgary (Alta.) and Vancouver (B.C.). Street indexes list street names and indicate in which census district and sub-district(s) those streets were enumerated.

The indexes for Hamilton and Calgary are specific to the 1931 Census. The indexes for the remaining cities cover multiple census years. In those indexes, for the purposes of locating district numbers for the 1931 Census, consider only entries beginning with “31.” The numbers that follow are the district and sub-district numbers, respectively, for 1931. So, for instance, if we are looking for a place of interest on Montréal’s Chemin de la Côte-des-Neiges in the census district of Mont-Royal (Census District no. 84), we find:

Typewritten entries for “Côte des Neiges” from the Montréal Street Index.

Excerpt from the Montréal Street Index (Finding Aid 31–80)

The numbers in the first line depicted above – “31–84–39, 40, 41, 43, 44, 45” – indicate that, in 1931, Chemin de la Côte-des-Neiges was enumerated in Census District no. 84, in census sub-districts 39 through 41 and 43 through 45.

Note: the street names featured in the indexes are historical; in other words, they are as written by the enumerator at the time, generally speaking.

Beware: the same street may have had its name written in multiple ways and thus appear in separate parts of the alphabetically ordered street index. In the case of Montréal’s Chemin de la CôtedesNeiges, entries are spread across three separate areas of the Montréal index, with the street name written as “Côte-des-Neiges,” “Côte des Neiges” and “Cote des Neiges.”

Tool 2: Finding aid for “Indian Reserves” (First Nations)

A listing of reserves by 1931 Census district and sub-district is available. This unverified finding aid could be useful if your place of interest was (in) a First Nations Reserve in 1931. We are currently working to adapt this pre-existing finding aid to include respectful terminology.

Tool 3: Written descriptions of sub-district boundaries

Written descriptions of sub-district boundaries were compiled by the Dominion Bureau of Statistics. These descriptions have been transcribed into finding aids for each province or territory: P.E.I., N.S., N.B., Que., Ont., Man., Sask., Alta., B.C., Y.T., N.T.

Note: the transcription of sub-district descriptions for select major cities may be forthcoming.

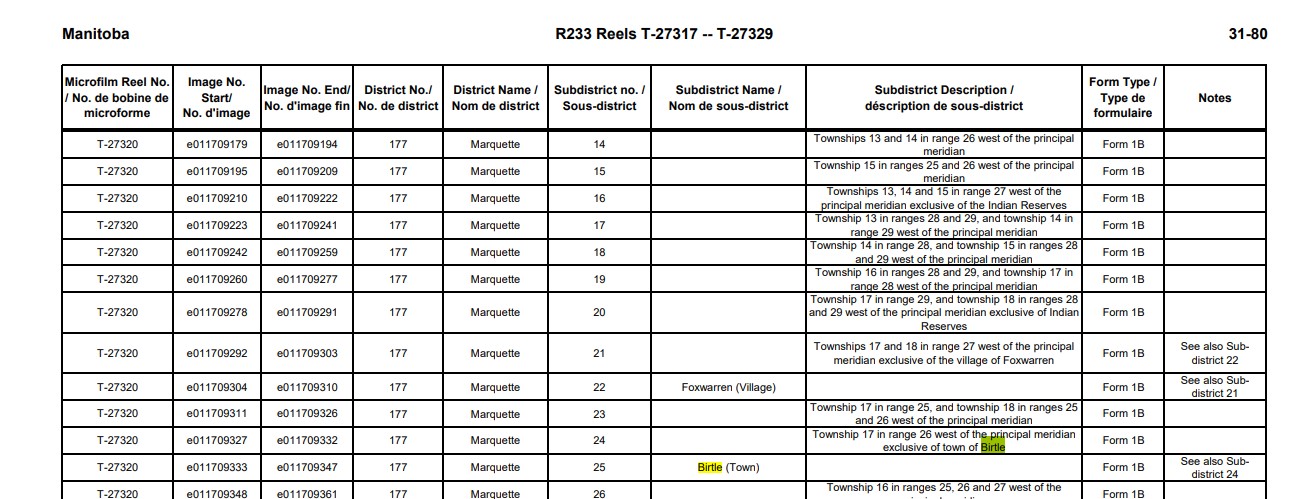
You may choose to begin with a keyword search related to your place of interest in the finding aid for a province or territory. For example, searching the Manitoba sub-district description finding aid for “Birtle” yields three results within the census district “Marquette”: sub-district 25 for “Birtle (Town)”; sub-district 24 for “Township 17 in range 26 west of the principal meridian exclusive of town of Birtle”; and sub-district 63 for the residential school of the same name. Alternatively, you may choose to navigate to a particular census district (like “Marquette”), then browse all sub-district descriptions within that census district.

An excerpt of a finding aid for Manitoba. The excerpt features several sub-district names and descriptions for within the Census District “Marquette.” Two instances of the word “Birtle” are highlighted.

Excerpt from the Finding Aid for the 1931 Census Returns for Manitoba (Finding Aid 31–80)

The characterization of census sub-districts varies tremendously. The descriptions may refer to townships, municipalities, city wards, polling divisions, reserves, parishes, meridians, ranges, lots, roads, islands, rivers, etc. Making sense of the descriptions may require consulting local maps from the era or learning about the local, provincial or other federal geographies leveraged for the purposes of the 1931 Census (e.g., municipal boundaries may have been established in contemporary provincial law).

Sometimes the sub-district descriptions do not themselves allow us to narrow things down to a single sub-district. To illustrate what we mean by that, we can look at sub-district descriptions for the census district of Mont-Royal.

A typewritten card listing sub-district ranges for different parts of the Mont-Royal district in Quebec, 1931.

The Dominion Bureau of Statistics’ working description of sub-districts in District 84, Mont-Royal (from material accompanying the transfer of the 1931 Census returns to Library and Archives Canada). Library and Archives Canada/Statistics Canada fonds/District 84, Mont-Royal, Quebec, 1931

The sub-district descriptions for Mont-Royal create a situation in which it is challenging to identify a single sub-district of relevance. If you face this situation, you then have two options:

  1. flip through the census returns for all relevant sub-districts; or
  2. narrow things down using other working tools, such as city directories, which might list wards, or using additional tools such as a Street Index, which is likely the best approach in the case of Montréal.

Sometimes additional sub-district descriptions feature on the title card preceding the sub-district’s census returns. Scans of the original Dominion Bureau of Statistics’ working descriptions of sub-districts are available online and, though cumbersome, may be used for troubleshooting purposes. To view these scans, go to the archival description for the 1931 Census returns in Collections Search, toggle open the details, then toggle open the finding aid section and scroll down.

Additional resources

  • To learn about the system of townships, ranges and meridians used in the three prairie provinces and the railway belt of British Columbia, consult the section titled Western Canada Land System Description on the homepage for our Land Grants of Western Canada database.
  • The blog post “Finding Royalton: Searching the 1921 Census” describes how a staff member locates small rural hamlets or unincorporated villages. It offers insights and ideas about how to overcome stalemates.
  • If you had already found your place of interest among the census returns from the 1921 Census of Canada or 1926 Census of Prairie Provinces, consider viewing the sub-district description in Census Search for that earlier census year. It might assist you in navigating the sub-district descriptions for the 1931 Census.

Again, wishing us all the best in our searches for people and places of the past.

As always, don’t forget that we can help: reach out to our genealogy team by using our Ask genealogy a question online form.

Expect the Unexpected!

By Forrest Pass

What do Inuit mapmakers, German composer Ludwig van Beethoven, a notorious Italian stamp forger and Soviet spies have in common? Their works are all represented in the collections at Library and Archives Canada. These artifacts are also showcased in Unexpected! Surprising Treasures From Library and Archives Canada, which opens at the Canadian Museum of History on Thursday, December 8, 2022. This new exhibition gives curious visitors a chance to see, first-hand, many intriguing items that they might not expect to find at Canada’s national library and archives.

The exhibition features some 40 original documents, maps, photographs, rare books and works of art. Regular readers of this blog will know that researchers and staff are always coming across surprises in the collection. A few of the items displayed in Unexpected! are perennial favourites. Others are new finds, the never-before-exhibited results of research into the unusual stories that library and archival collections can reveal.

A handwritten document on lined paper, with some words in black ink scratched out in red ink.

A secret agent receives instructions from his handlers. The delivery of this and other Soviet espionage documents to Canadian authorities in 1945 helped to start the Cold War. (e011316511_s1)

These stories are clustered around three themes. The first, Wonders, presents artifacts that delighted or intrigued their audiences when they were created, and they continue to do so today. Visitors will discover how a manuscript composition by Beethoven ended up in Canada. They can experience an 18th-century version of virtual reality. They may also contemplate two contrasting visions of the Arctic: one, the product of an imaginative European cartographer who had never visited the region, and the other, the work of two Inuit mapmakers with deep connections to the land.

A street with pink, green and beige buildings, soldiers, a dog, and a horse and carriage.

Perspective views, like this imaginary street scene in the city of Québec, appear to be three-dimensional when viewed through a device called a zograscope. The exhibition features a reconstructed zograscope, enabling visitors to experience virtual reality, 1770s-style. (e011309357)

In the second theme, Secrets, Unexpected! explores how and why people keep secrets, and how they share secrets with those who need to know. Visitors can crack a coded love letter, ponder the rich symbolism of a centuries-old masonic ritual painting, and find out why the Dominion Archivist once mused (or “mew-sed”?) about putting cats on the government payroll.

The final theme, Mysteries, presents some unresolved puzzles. Here, visitors can pore over the contents of a UFO investigation file, or come face to face with the rare “Fool’s Cap Map,” printed in the 1500s and perhaps the most mysterious map ever created.

Two yellow stamps placed diagonally on a page. They both have a blue ink stamp.

One of these 1851 New Brunswick postage stamps is a forgery. Can you spot the fake? (e011309360 and e011309361)

The stories that these artifacts tell can be funny, thought-provoking or simply curious. What links them all is that each artifact, when you scratch beneath its surprising surface, reveals something important about the past. There are good reasons why they have found their way into the collections at Library and Archives Canada.

This is the latest in a series of exhibitions developed in partnership between Library and Archives Canada and the Canadian Museum of History. As the curator for Unexpected!, I have had the privilege and pleasure of collaborating on this project with a multidisciplinary team of exhibition and collections professionals from both institutions. In addition to providing the venue, the museum has contributed creative development expertise and a scenographic approach that recalls the look and feel of mid-century mysteries and spy thrillers. The museum’s technicians also took up the challenge of constructing several interactive elements that will enhance visitors’ understanding and appreciation of the original artifacts.

Unexpected! Surprising Treasures From Library and Archives Canada is at the Canadian Museum of History until November 26, 2023. Watch this blog as well as Library and Archives Canada’s social media channels in the coming weeks and months to learn more about the astonishing treasures on display.


Forrest Pass is a curator in the Exhibitions team at Library and Archives Canada.

Plaisance: A French fishing colony in Newfoundland

By Valerie Casbourn

Library and Archives Canada (LAC) holds records related to the French colonial period in early Canada, and some of these records are available online. Included are records about the French cod fishery in the Atlantic region and the French colony of Plaisance in Newfoundland (1662–1713).

During the 17th century, the cod fishery in Newfoundland became increasingly important to the European fishing industry. France was one of several European countries competing for a share of this fishery, and in 1662, the French established a garrison town at Plaisance, on the western side of Newfoundland’s Avalon Peninsula. The French wanted to secure their merchant fishing fleet’s access to the fishery and their share of the European market for cod.

The site of Plaisance was chosen for its proximity to rich fishing grounds, its sheltered and relatively ice-free harbour, and its strategic location. Eventually, the colony of Plaisance grew to have a small permanent population, with military fortifications, and served as a base for the French Atlantic cod fishery.

A hand-drawn and coloured illustration that shows the shore with people on a wooden stage working on curing and drying cod in Newfoundland.

A view of a stage and also of the manner of fishing for, curing and drying cod at New Found Land […] (c003686) A digitized copy of the map L’Amerique, divisee selon l’etendue de ses Principales Parties, et dont les Points Principaux sont placez sur les Observations de Messieurs de L’Academie Royale des Sciences. Dressee Par N. de Fer, Geographe de Monseigneur le Dauphin can be seen at the Osher Map Library website.

The French and English established colonies along the southeastern coast of Newfoundland, which encroached on the Indigenous territory of the Beothuk and the Mi’kmaq. The French had little recorded interaction with the Beothuk, who withdrew from the coast and its resources to avoid contact with the European fishermen and colonists. Before the arrival of the colonies the Mi’kmaq navigated the waters between Cape Breton and Newfoundland by canoe. They established friendly relations with the French, becoming important trading partners and military allies.

The colony of Plaisance encountered many difficulties, particularly during its first few decades. Its population was small and poorly supplied, and its early governors were ineffective. However, in the 1690s, the colony became stronger, and the French administration highly valued the Atlantic fishery.

The economy of Plaisance was largely based on the cod fishery. The colony’s small permanent population with its “habitants-pêcheurs” was bolstered each year with the arrival of a large seasonal workforce on the merchant fleet from French ports. All worked intensely to catch and preserve cod during the summer months. The residents of Plaisance relied on the merchant fleet to bring extra labourers, food and manufactured goods, and to ship their dried catch back to Europe to be sold.

During this period, there was ongoing conflict between the French and the English, as well as between the Mi’kmaq and the English. In the 1690s and early 1700s, both the French and the Mi’kmaq conducted raids, sometimes jointly, on English settlements on the Avalon Peninsula. The War of the Spanish Succession culminated in the Treaty of Utrecht, signed in 1713, in which France ceded its claim to Newfoundland to England. The English took over the settlement of Plaisance, changing its name to Placentia. Most of the French colonists moved south to the colony of Ile Royale (now Cape Breton). There they established themselves in the new French settlement of Louisbourg and continued their work in the French cod fishery. The French also retained the right to fish off the coasts of Newfoundland and to process their catch along stretches of the shoreline, known as the French Shore.

Nautical chart, on vellum in coloured ink, of the coastline of Newfoundland, Acadia and the Gulf of St. Lawrence.

Nautical chart of the coastline of Newfoundland, Acadia and the Gulf of St. Lawrence. Produced after 1713, the chart shows both Plaisance and Louisbourg (e011182107)

Records at Library and Archives Canada

LAC holds records related to the colony of Plaisance, among other topics, in the Fonds des Colonies (MG1). This fonds includes copies and transcriptions of selected records related to the French colonial period in early Canada. The records are in French, and the original documents are held at the Archives nationales d’outre-mer in Aix-en-Provence, France. The Fonds des Colonies consists of records including correspondence, reports, journals, instructions, records of fortifications and commerce, civil registers, and notary documents.

Many records in the Fonds des Colonies have been digitized and are available directly on the LAC website. Use LAC’s Collection Search to search for records about the colony of Plaisance. Try keyword searches, such as “MG1 Plaisance” or “MG1 pêche” (without quotation marks), and use the drop-down menu to search “Archives.” Including “MG1” will limit your search results to records in the Fonds des Colonies; you can search more broadly by not including it. Because the original records are in French, try using French keywords such as “pêche” (fishing), “Terre-Neuve” (Newfoundland), or “morue” (cod).

Related resources


Valerie Casbourn is an archivist based in Halifax with Regional Services at Library and Archives Canada.

Samuel de Champlain’s General Maps of New France

Version française

In the fall of 1612, Samuel de Champlain had an engraving of his first detailed map of New France made in Paris. The map contained new geographic information, based on his own explorations from 1603 onward. The site of Montreal is clearly identified. Using information obtained from Aboriginal peoples, he was able to include previously uncharted areas, such as Lake Ontario and Niagara Falls. He also made use of other maps to depict certain regions, including Newfoundland. Although the engraving was made in 1612, the map was not published until the following year as an appendix to Voyages, Champlain’s 1613 account of his journeys.

Carte geographique de la Nouvelle Franse faictte par le sieur de Champlain Saint Tongois cappitaine ordinaire pour le roy en la marine. Faict len 1612.

Carte geographique de la Nouvelle Franse faictte par le sieur de Champlain Saint Tongois cappitaine ordinaire pour le roy en la marine. Faict len 1612.(e010764733)

While back in France in the summer of 1613, Champlain had an engraving made of a second version of a general map that he had begun the previous year, which he also published in his 1613 book. In that map, he incorporated his most recent geographic findings, including the Ottawa River, which he was the first to depict. His depiction of Hudson Bay was deliberately inspired by a map of Henry Hudson’s voyages.  

Carte geographique de la Nouvelle Franse en son vray meridiein. Faictte par le Sr Champlain, Cappine. por le Roy en la marine – 1613.

Carte geographique de la Nouvelle Franse en son vray meridiein. Faictte par le Sr Champlain, Cappine. por le Roy en la marine – 1613. (e010764734)

An incomplete general map by Champlain also exists. The engraving was made in 1616, although the map was never published. The only known copy is held by the John Carter Brown Library.

In 1632, Champlain published his last major map of New France, which was included in his final book, Les Voyages de la Nouvelle France occidentale, dicte Canada. He had been living in France for nearly three years, having been driven out of Quebec by the Kirke brothers in 1629. This updated map contains little new information verified by Champlain himself, as his own explorations came to an end in 1616. He based the revised version on the invaluable information conveyed to him by others, chief among them Étienne Brûlé. Nevertheless, this map represents an important milestone in the history of North American cartography and was widely used by other mapmakers. There are two versions of this map. Among the differences between them are the representation of Bras d’Or Lake or a chain of mountains on Cape Breton Island. Both versions of the map are held by Library and Archives Canada. The first can be seen here:

Carte de la Nouvelle France, augmentée depuis la derniere, servant a la navigation faicte en son vray meridien, 1632.

Carte de la Nouvelle France, augmentée depuis la derniere, servant a la navigation faicte en son vray meridien, 1632. (e010771375)

Suggested reading to learn more about this subject: Conrad E. Heidenreich and Edward H. Dahl, “Samuel de Champlain’s Cartography, 1603-32”, in Raymonde Litalien and Denis Vaugeois, eds., Champlain: The Birth of French America. Sillery: Les éditions du Septentrion; and Montreal and Kingston: McGill-Queen’s University Press, 2004, pp. 312-332.